Show the code
knitr::kable(
airquality[1:6, 1:6]
)| Ozone | Solar.R | Wind | Temp | Month | Day |
|---|---|---|---|---|---|
| 41 | 190 | 7.4 | 67 | 5 | 1 |
| 36 | 118 | 8.0 | 72 | 5 | 2 |
| 12 | 149 | 12.6 | 74 | 5 | 3 |
| 18 | 313 | 11.5 | 62 | 5 | 4 |
| NA | NA | 14.3 | 56 | 5 | 5 |
| 28 | NA | 14.9 | 66 | 5 | 6 |
This is a post with executable code check
knitr::kable(
  mtcars[1:6, 1:10]
)| mpg | cyl | disp | hp | drat | wt | qsec | vs | am | gear | |
|---|---|---|---|---|---|---|---|---|---|---|
| Mazda RX4 | 21.0 | 6 | 160 | 110 | 3.90 | 2.620 | 16.46 | 0 | 1 | 4 |
| Mazda RX4 Wag | 21.0 | 6 | 160 | 110 | 3.90 | 2.875 | 17.02 | 0 | 1 | 4 |
| Datsun 710 | 22.8 | 4 | 108 | 93 | 3.85 | 2.320 | 18.61 | 1 | 1 | 4 |
| Hornet 4 Drive | 21.4 | 6 | 258 | 110 | 3.08 | 3.215 | 19.44 | 1 | 0 | 3 |
| Hornet Sportabout | 18.7 | 8 | 360 | 175 | 3.15 | 3.440 | 17.02 | 0 | 0 | 3 |
| Valiant | 18.1 | 6 | 225 | 105 | 2.76 | 3.460 | 20.22 | 1 | 0 | 3 |
knitr::kable(
  airquality[1:6, 1:6]
)| Ozone | Solar.R | Wind | Temp | Month | Day |
|---|---|---|---|---|---|
| 41 | 190 | 7.4 | 67 | 5 | 1 |
| 36 | 118 | 8.0 | 72 | 5 | 2 |
| 12 | 149 | 12.6 | 74 | 5 | 3 |
| 18 | 313 | 11.5 | 62 | 5 | 4 |
| NA | NA | 14.3 | 56 | 5 | 5 |
| 28 | NA | 14.9 | 66 | 5 | 6 |
library(ggplot2)
ggplot(airquality, aes(Temp, Ozone)) +
  geom_point() +
  geom_smooth(method = "loess"
)
`geom_smooth()` using formula = 'y ~ x'Warning: Removed 37 rows containing non-finite values (`stat_smooth()`).Warning: Removed 37 rows containing missing values (`geom_point()`).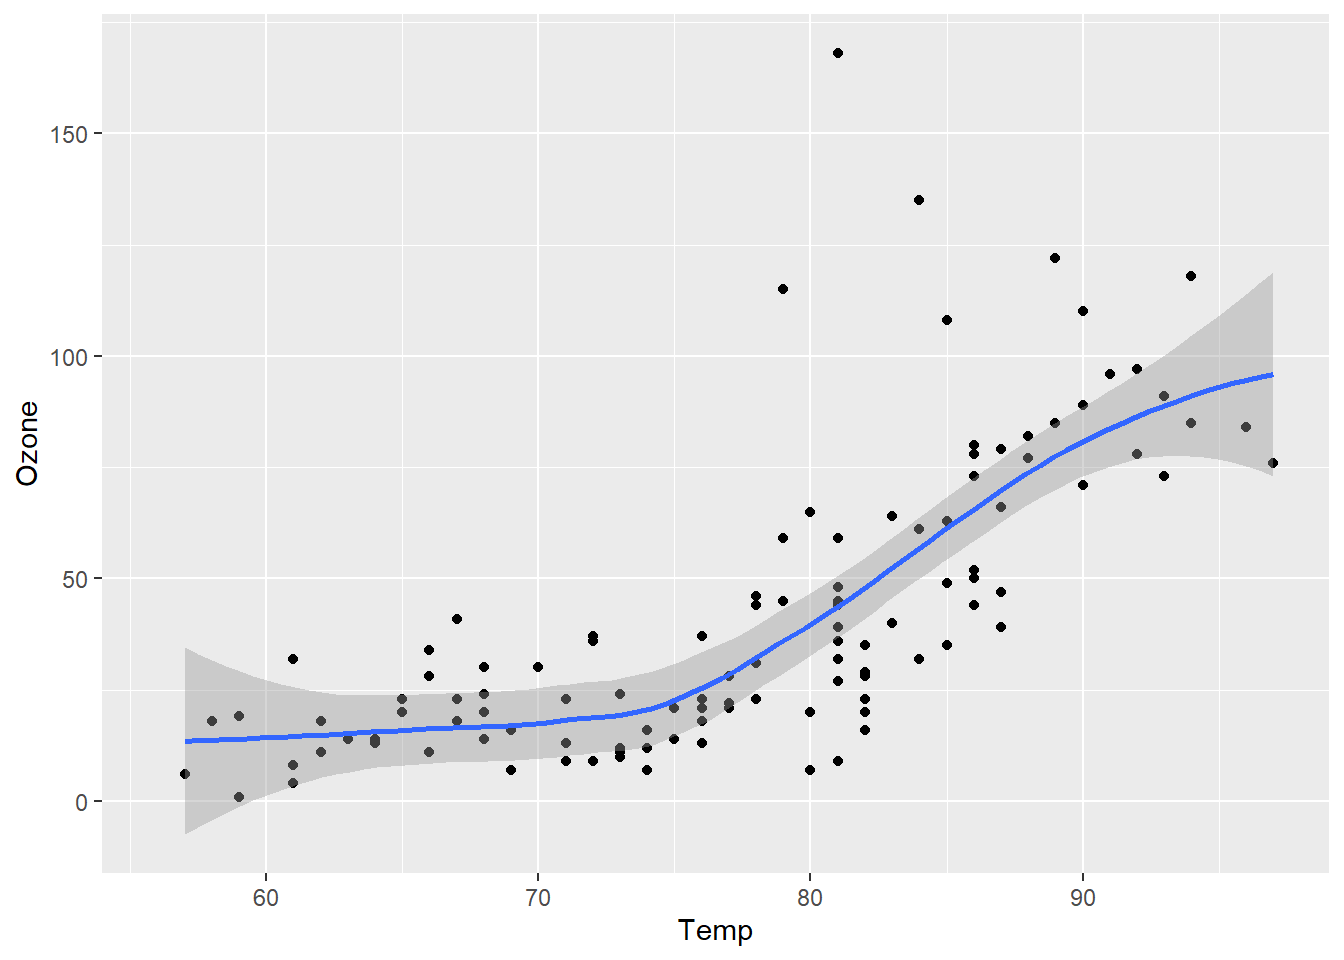
# Install these packages if you have not already
# install.packages(c('DBI', 'RPostgres'))
library(DBI)
library(RPostgres)con <- DBI::dbConnect(
RPostgres::Postgres(),
dbname = 'tutorialdb',
host = 'localhost',
port = 5432,
user = 'postgres',
password = 'sumendar' # insert your password here
)DBI::dbGetQuery(con, 'SELECT customer_id, name, location, email FROM customers LIMIT 3') customer_id name location email
1 1 Orlando Australia
2 2 Keith India keith0@adventure-works.com
3 3 Donna Germany donna0@adventure-works.comimport math
print(math.sqrt(81))9.0import pandas as pd
df = pd.read_csv("medals.csv")
df.head() Year City Sport ... Event Event gender Medal
0 1924 Chamonix Skating ... individual M Silver
1 1924 Chamonix Skating ... individual W Gold
2 1924 Chamonix Skating ... pairs X Gold
3 1924 Chamonix Bobsleigh ... four-man M Bronze
4 1924 Chamonix Ice Hockey ... ice hockey M Gold
[5 rows x 8 columns]import matplotlib.pyplot as plt
import numpy as np
# Some example data to display
x = np.linspace(0, 2 * np.pi, 400)
y = np.sin(x ** 2)
fig, axs = plt.subplots(2, 2)
axs[0, 0].plot(x, y)
axs[0, 0].set_title('Axis [0, 0]')
axs[0, 1].plot(x, y, 'tab:orange')
axs[0, 1].set_title('Axis [0, 1]')
axs[1, 0].plot(x, -y, 'tab:green')
axs[1, 0].set_title('Axis [1, 0]')
axs[1, 1].plot(x, -y, 'tab:red')
axs[1, 1].set_title('Axis [1, 1]')
for ax in axs.flat:
ax.set(xlabel='x-label', ylabel='y-label')
# Hide x labels and tick labels for top plots and y ticks for right plots.
for ax in axs.flat:
ax.label_outer()
plt.show()Traceback (most recent call last):
File "C:\Users\ADMINI~1\ANACON~1\lib\site-packages\matplotlib\backends\backend_qt.py", line 477, in _draw_idle
self.draw()
File "C:\Users\ADMINI~1\ANACON~1\lib\site-packages\matplotlib\backends\backend_agg.py", line 436, in draw
self.figure.draw(self.renderer)
File "C:\Users\ADMINI~1\ANACON~1\lib\site-packages\matplotlib\artist.py", line 73, in draw_wrapper
result = draw(artist, renderer, *args, **kwargs)
File "C:\Users\ADMINI~1\ANACON~1\lib\site-packages\matplotlib\artist.py", line 50, in draw_wrapper
return draw(artist, renderer)
File "C:\Users\ADMINI~1\ANACON~1\lib\site-packages\matplotlib\figure.py", line 2837, in draw
mimage._draw_list_compositing_images(
File "C:\Users\ADMINI~1\ANACON~1\lib\site-packages\matplotlib\image.py", line 132, in _draw_list_compositing_images
a.draw(renderer)
File "C:\Users\ADMINI~1\ANACON~1\lib\site-packages\matplotlib\artist.py", line 50, in draw_wrapper
return draw(artist, renderer)
File "C:\Users\ADMINI~1\ANACON~1\lib\site-packages\matplotlib\axes\_base.py", line 3055, in draw
self._update_title_position(renderer)
File "C:\Users\ADMINI~1\ANACON~1\lib\site-packages\matplotlib\axes\_base.py", line 2989, in _update_title_position
if (ax.xaxis.get_ticks_position() in ['top', 'unknown']
File "C:\Users\ADMINI~1\ANACON~1\lib\site-packages\matplotlib\axis.py", line 2229, in get_ticks_position
self._get_ticks_position()]
File "C:\Users\ADMINI~1\ANACON~1\lib\site-packages\matplotlib\axis.py", line 1937, in _get_ticks_position
minor = self.minorTicks[0]
IndexError: list index out of range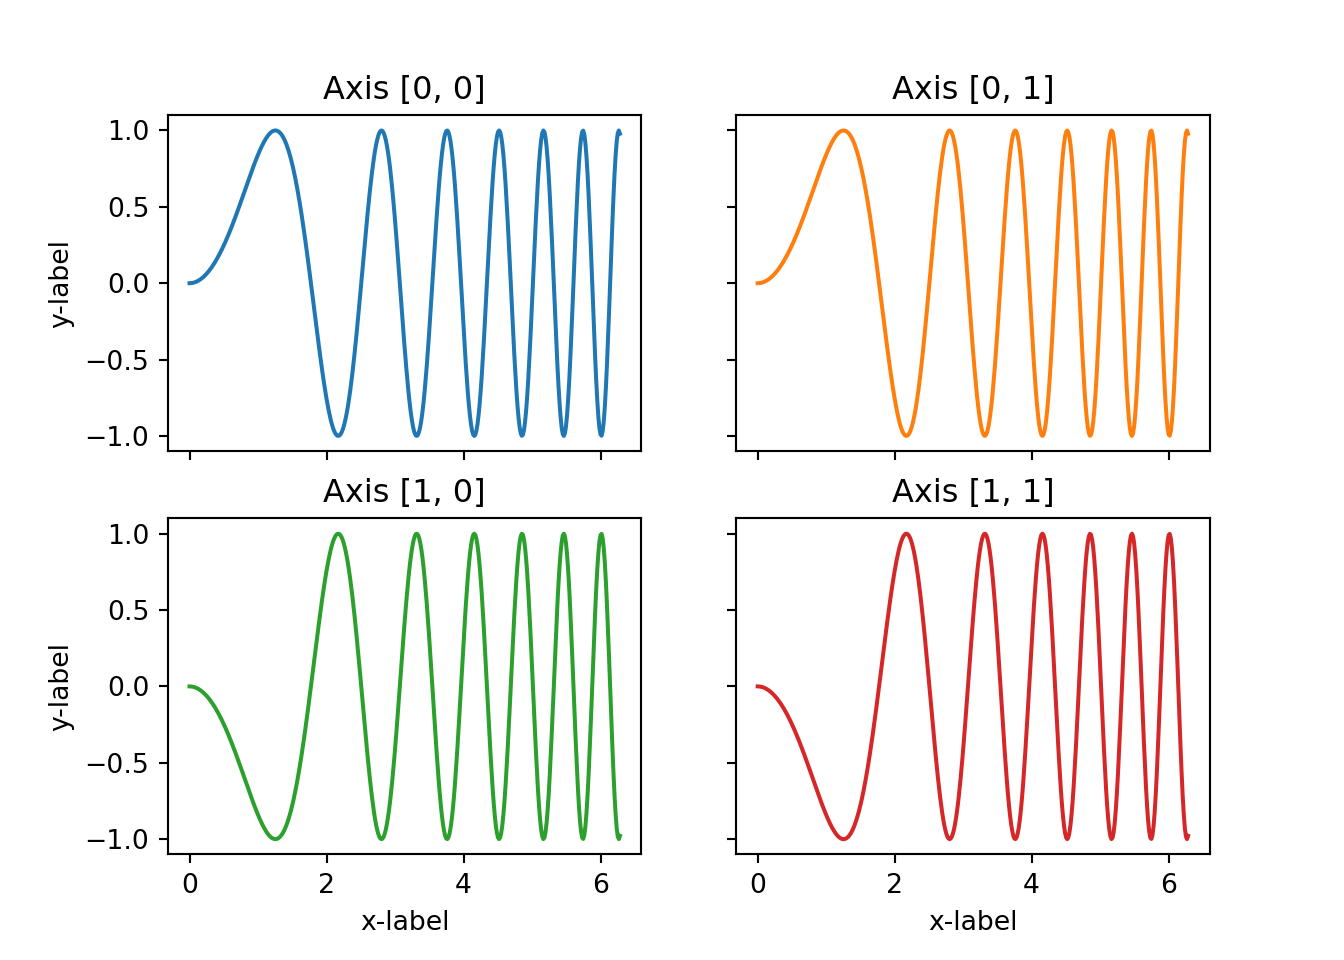

::: {style=” background-color: #F4F4F4; border-radius: 4px; flex-grow: 0; height: 14px; margin-bottom: 6px; width: 100px;“}
::: {style=” background-color: #F4F4F4; border-radius: 4px; flex-grow: 0; height: 14px; width: 60px;“} ::: ::: :::
::: {style=” color:#3897f0; font-family:Arial,sans-serif; font-size:14px; font-style:normal; font-weight:550; line-height:18px;“} View this post on Instagram
:::
::: {style=” background-color: #F4F4F4; border-radius: 50%; flex-grow: 0; height: 20px; width: 20px;“}
::: {style=” width: 0; height: 0; border-top: 2px solid transparent; border-left: 6px solid #f4f4f4; border-bottom: 2px solid transparent; transform: translateX(16px) translateY(-4px) rotate(30deg)“}
:::
::: {style=” width: 0px; border-top: 8px solid #F4F4F4; border-right: 8px solid transparent; transform: translateY(16px);“}
::: {style=” background-color: #F4F4F4; flex-grow: 0; height: 12px; width: 16px; transform: translateY(-4px);“} :::
::: {style=” width: 0; height: 0; border-top: 8px solid #F4F4F4; border-left: 8px solid transparent; transform: translateY(-4px) translateX(8px);“} ::: ::: :::
::: {style=” background-color: #F4F4F4; border-radius: 4px; flex-grow: 0; height: 14px; margin-bottom: 6px; width: 224px;“}
::: {style=” background-color: #F4F4F4; border-radius: 4px; flex-grow: 0; height: 14px; width: 144px;“} ::: :::
A post shared by allinpython (@allinpython)
:::
Embedding Tableau Public Views in iFrame source:
Embedding Power BI Report in iFrame source:
import pandas as pd
for i in range(10):
    print(i)
0
1
2
3
4
5
6
7
8
9